01 / Ultimate Combo Chart
Interactive waterfall
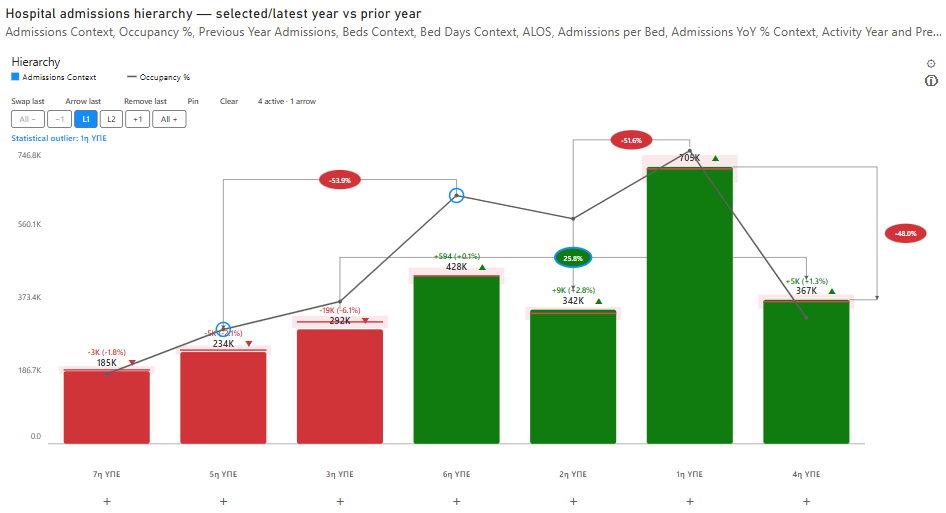
Follow hierarchical financial flow through intermediate totals to the final result.
View original image ↗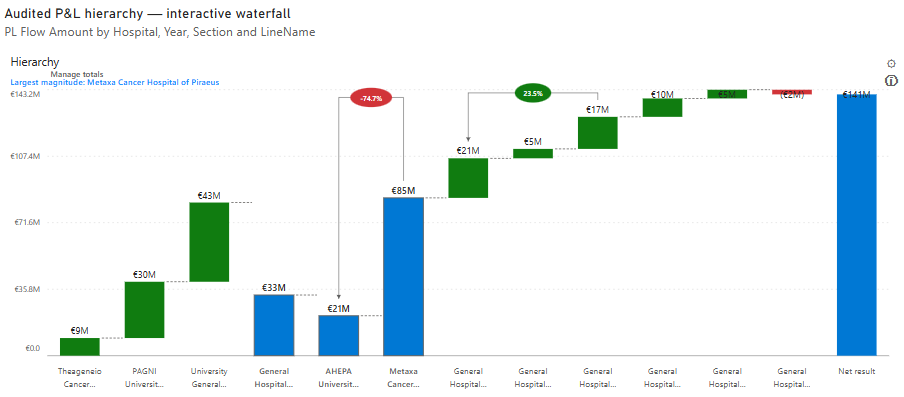


Go beyond standard charts. Explore hierarchies, compare performance, combine visual forms and analyze your data from multiple perspectives — without leaving a single Power BI visual.

Real examples from Ultimate Combo Chart show how one visual can combine hierarchy, analytical comparison and direct user interaction.
Follow hierarchical financial flow through intermediate totals to the final result.
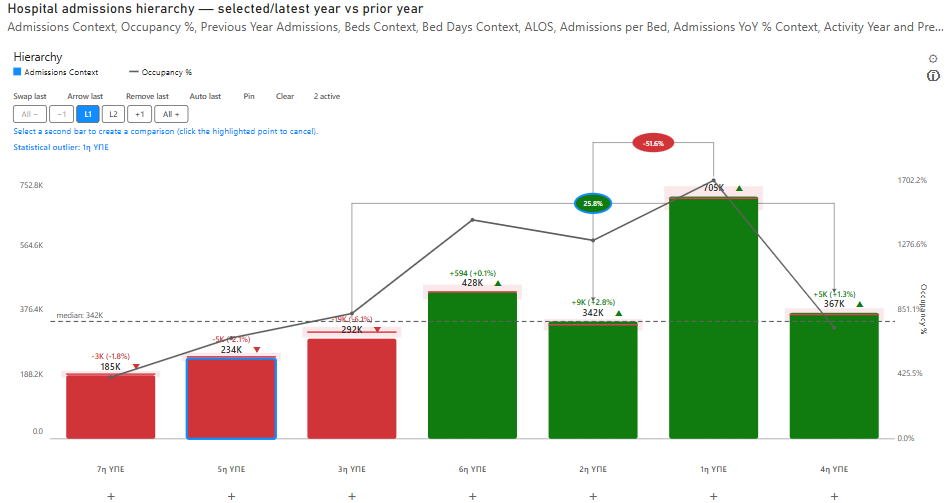
View original image ↗Compare selected hierarchy points directly in the chart while retaining analytical context.
View original image ↗
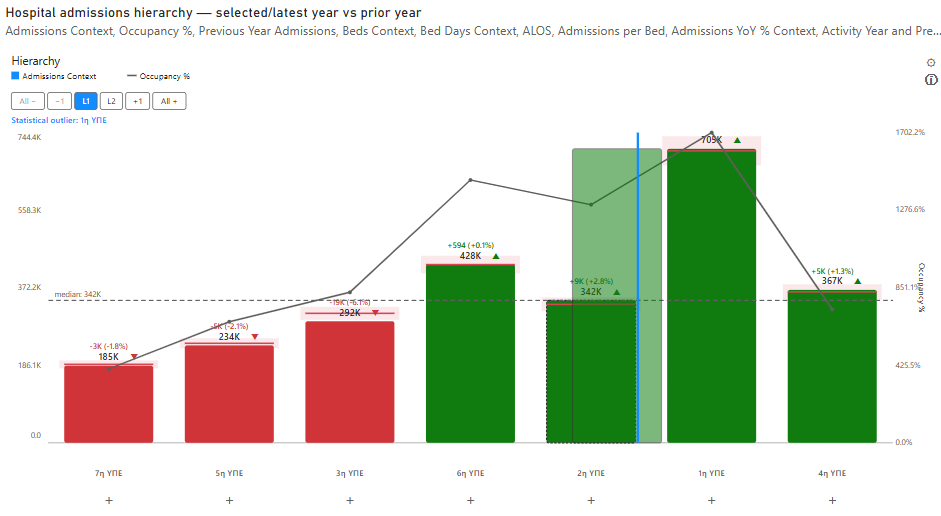
Select a comparison point and explore relationships directly within the visual.
View original image ↗
Reorganize the analytical view and inspect performance from a different perspective.
View original image ↗
Ultimate Combo Chart combines flexible visualization with hierarchical exploration and analytical tools, helping users move from high-level performance to the underlying detail.
Bar, column, stacked, 100% stacked, waterfall and combination visualizations.
Navigate multi-level structures while maintaining analytical context.
Isolate and explore a selected hierarchy branch without losing context.
Compare selected categories and analytical perspectives directly within the visual.
Organize information based on values and analytical requirements.
Go beyond absolute values to understand relative performance and contribution.
Selections, tooltips, context interactions and integration with the surrounding report.
Provide users with guidance directly inside the visual.
Ultimate Combo Chart is particularly useful when reporting needs go beyond displaying a single measure against a simple category.
Combine performance, context and analytical comparisons in one view.
Analyze variance, contribution and hierarchical financial structures.
Move from summary KPIs to deeper operational detail.
Explore multi-level structures with focused navigation and context.
For installation, configuration, rendering, compatibility or product questions, use our dedicated support page or contact us directly.
Greece
Certified Power BI visual available now on Microsoft Marketplace / AppSource.